Let us welcome the publication of the index of Gini On December 17, this index of income disparities, France (with 0.293 approaching the 0 of equality) is rather less unequal than the average for Europeans:

A question asked daily: how many French people are below the proposed quota of 9t/year in the first year.
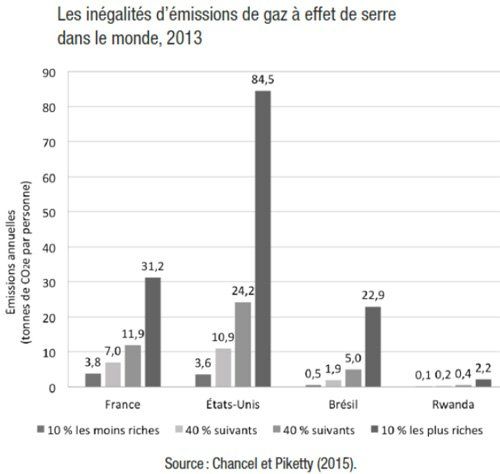
Scientists are working on it, Lucas Chancel has just updated and developed the study cited further on climate inequalities in the world:
We will retain two graphs for France and Europe:


The average values for France and Europe are therefore quite similar*, especially for the 50% of people with the lowest incomes. The average announced of 8.7 is close to the value of 9 by the Ministry. The 610 million t are divided into 5t for the 50% of French people with low incomes, 9.3 for the 40% of French people in deciles 6-7-8-9 and 25t/year/person for the 10th decile, the 10% of French people with the highest incomes (whose footprint is also decreasing faster than the others, decreasing by more than 5t/p in 30 years).
(*) these are the average values which are similar for Europe, but large disparities remain between Germans or Luxembourgers and Romanians or Slovaks, making it impossible to pool the progressive ceiling and requiring European coordination as proposed by www.cequic.eu
To answer the question, we assume that 65% of the French population would be below 9t/year/person upon reading this brilliant study. 61% would be below the second year quota and 57% would be below the 3rd year quota...
Thoughts on climate change: out of 1000 young French people, how many believe that:
· People have not taken care of the planet: 77%
· The future is scary: 74%
· Humanity is doomed: 48%
· Fewer opportunities than parents: 61%
· Most things you love will be destroyed: 45%
· Family life security will be threatened: 50%
· I hesitate to have children: 37%
It can be compared to the nine other countries studied by Caroline Hickman's team in seven universities.
IPCC report of August 9, 2021
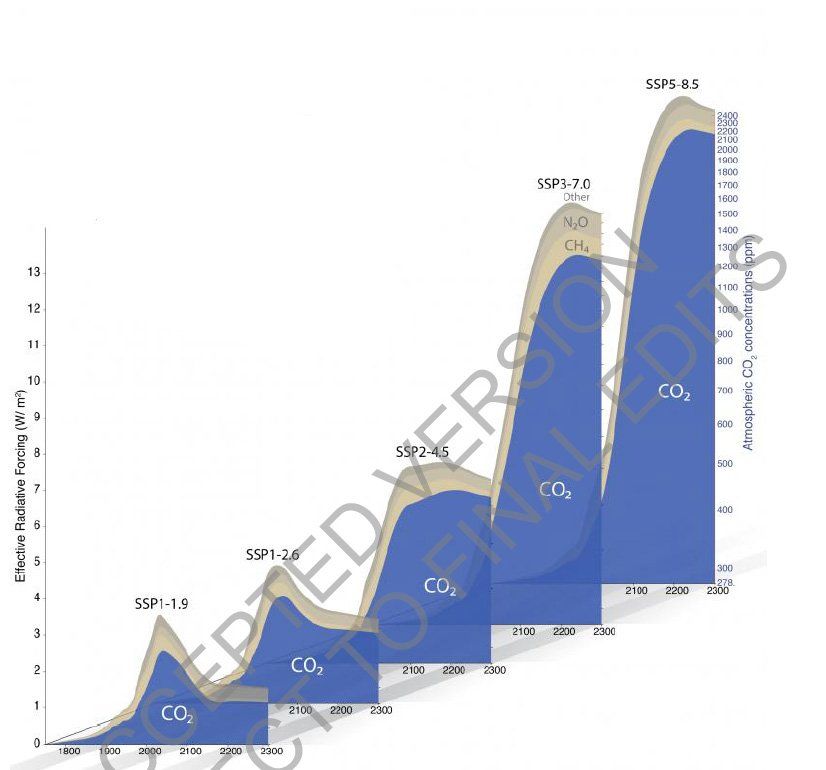
An exceptional figure (page 1.212 under number 1.29) shows us the greenhouse gases in the 5 most commonly used scenarios (CO2 in blue, methane in light gray and nitrous oxide in dark gray). The SSP5-8.5 scenario called "do nothing" leads to a CO2 peak in 2200 at 2100 ppm (5 times more than today, a rate for which NASA claims that we lose 40% of our capacities).
The SSP1-1.9 scenario (that of the carbon account) shows a return to the concentration of 2000 from 2150, having passed through more than 500ppm in around 2040.
The supply chain must take carbon content into account according to the rating agency ECOVADIS, which is kicking up a snag in the anthill of European industrial greenwashing arrangements:
A two-minute film to be broadcast, proposed by Nicolas Chateauneuf for the France 2 news on January 15, 2021:
The best resources are online thanks to the speakers of www.assisesduclimat.fr
Risk of earth-oven
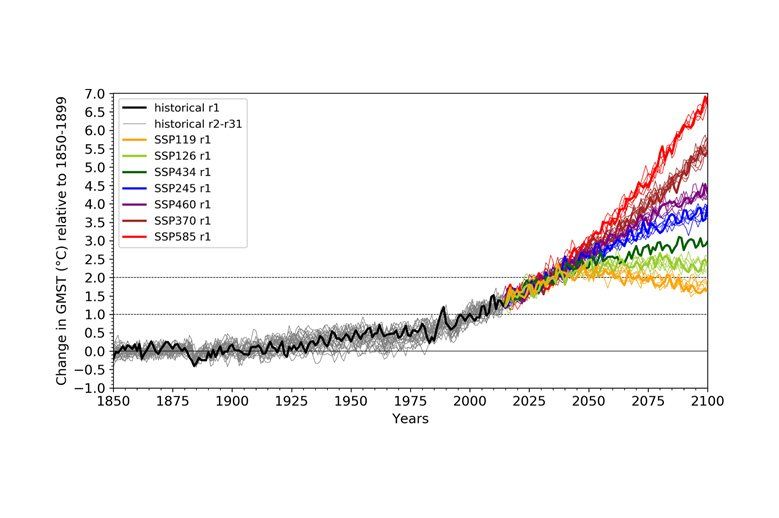
It has been observed that for 100,000 years, the average temperature of the globe and the sea level have fluctuated according to CO2 levels of 200 to 300ppm. Since the Anthropocene less than two centuries ago, CO2 has increased sharply to reach 410ppm* currently. Scientists predict that we can still stabilize the movement if we limit warming to 2°C (at least 1.5°C). If we do not reduce our greenhouse gases by 40% before 2030, then the planet is heading towards a chaotic, absolutely unstable functioning, as shown at the top right of the curve.
* ppm = parts per million or grams per tonne.
Question of "profitability": France Stratégie, through its "Value of Action for the Climate" commission, published a study in February 2019 estimating the tutelary value of a tonne of carbon at €90 in 2020, €250 in 2030 and €775 in 2050, according to the report included in this illustrated page with an interview with Alain Quinet: 'https://www.strategie.gouv.fr/publications/de-laction-climat' (clarification: this is expressed in euros/tonne of CO2 eq.).
In the
https://fr.wikipedia.org/wiki/Compte_carbone#Effects_pour_l’emploi It is estimated that 50,000 jobs will be created, which could cost France €2 billion per year; let's divide these €2 billion by the value of the CO2 avoided:
The planned 6% reduction of the total of 700 million tonnes amounts to 42 million tonnes.
Each tonne avoided would therefore cost €48, or €42 in savings per tonne compared to the 2020 assessment of €90 by France Stratégie.
The same Wikipedia study estimates that a tonne of carbon could quickly reach €1,000, which is barely one euro per kg of CO2 equivalent.
Less cognitive abilities
How much do we emit?
Please note that in June 2022, the HCC is publishing an excellent annual report where it reports that the 2020 French footprint is:
France's total carbon footprint is estimated
to 552 Mt eqCO2 in 2020, according to provisional estimates
the most recent from the SDES. Reported to the population,
the carbon footprint is 8.2 Mt eqCO2 per
inhabitant in 2020... Hard to follow, right? Let's wait for the next correction, the 6% increase brings it to 585, not far from the 610 announced by the Ministry for 2019.
October 2020, the HCC publishes its file on imported carbon which confirms our approach of counting all carbon in the purchases and services of all consumers: it recommends four levers, incentivizing companies (and here we incentivize companies through their customers), incentivizing consumers, harmonizing it across Europe and stopping imported deforestation.
The European comparison table is based on 2012 data, it is taken from the report HCC from October 2020
In his
report of November 24, 2020, the High Council for Climate reports that (contrary to our old visual below) "buildings are responsible for 36% of greenhouse gas emissions in the European Union and 28% in France, taking into account indirect emissions linked to the production of electricity and heat (…) Buildings thus consume nearly 40% of final energy in Europe."
See the full report attached, still weak compared to what carbon counting would bring...
It is the Hawaiian observatory of Mauna Loa which most precisely follows the evolutions of carbon dioxide in the global atmosphere, the record was reached in April 2020 with 416 ppm according to thestudy Météo-Contact. A Canadian satellite tracks methane emissions in real time by providing striking images of the globe according to Futura-Sciences.
here in pdf (the most complete file we know of):
The distribution of consumption has been re-evaluated by the High Council for Climate in a file presented at www.assiseduclimat.fr (file available below), it results in two explicit graphs on the responsibility of imports in our overall French footprint:
European data
Carbon sinks
The currency
A great team around our friend Vianney has put together a set of proposals to broaden the audience of the carbon accounting principle. We suggest you study the PowerPoint presentation that was presented on November 10 (and renewed on March 11) at the national Shifters meeting, below: (their 184-page report has been under review in the national shifters office since June, with validation due in November 2021).


